Below you will find charts and graphs of turkey production, prices and value in California. The data given was pulled from the CDFA 2006 Directory. You can download the charts and graphs in Microsoft Excel format by clicking here.
If you would like information on the 4-step process on how turkey gets from the farm to the fork, click here.
| Turkey Production Statistics | ||||||
| Year | Turkeys Produced |
Meat Produced | $/lb. | Total Value | Lbs. of meat produced/turkey | Avg Pice/Turkey |
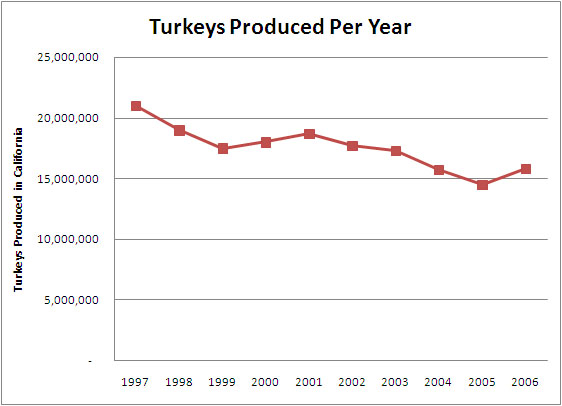
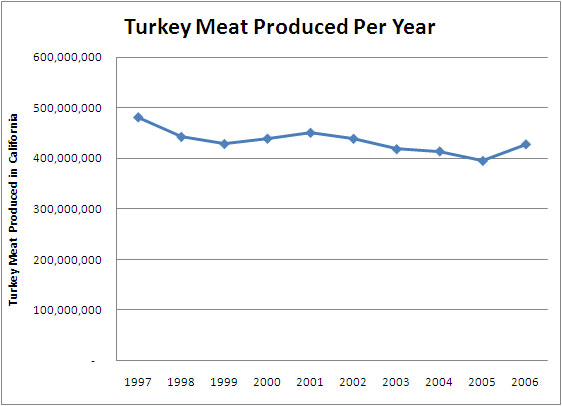
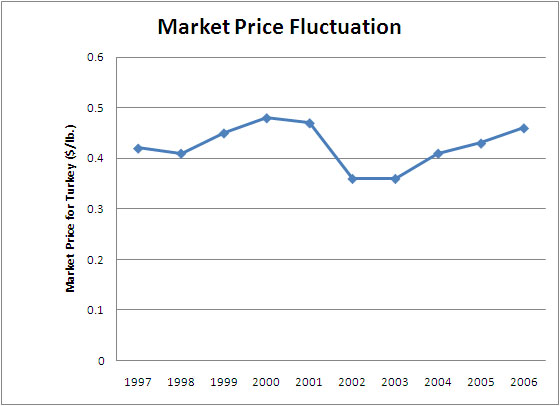
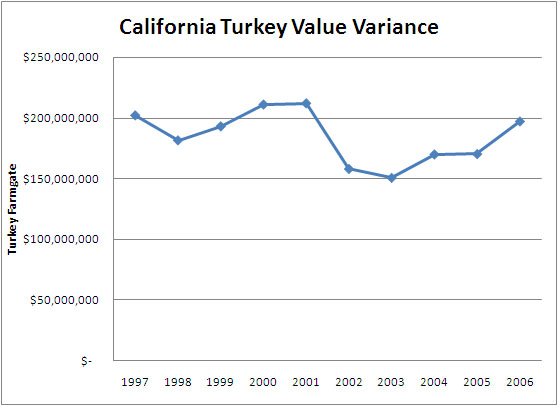
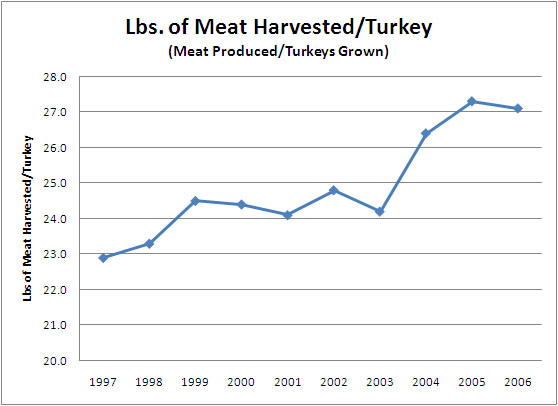
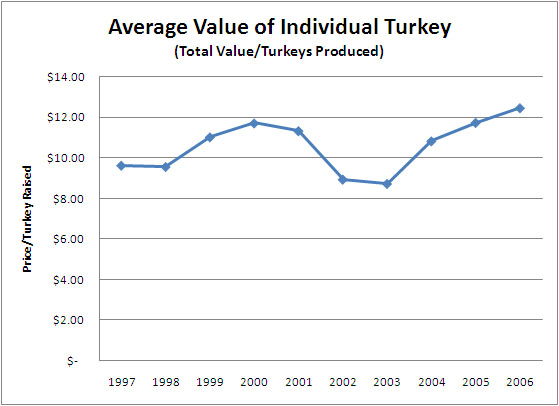
| 1997 | 21,000,000 | 480,900,000 | 0.42 | $201,978,000 | 22.9 | $9.62 |
| 1998 | 19,000,000 | 442,700,000 | 0.41 | $181,507,000 | 23.3 | $9.55 |
| 1999 | 17,500,000 | 428,750,000 | 0.45 | $192,937,500 | 24.5 | $11.03 |
| 2000 | 18,000,000 | 439,200,000 | 0.48 | $210,816,000 | 24.4 | $11.71 |
| 2001 | 18,700,000 | 450,670,000 | 0.47 | $211,814,900 | 24.1 | $11.33 |
| 2002 | 17,700,000 | 438,960,000 | 0.36 | $158,025,600 | 24.8 | $8.93 |
| 2003 | 17,300,000 | 418,660,000 | 0.36 | $150,717,600 | 24.2 | $8.71 |
| 2004 | 15,700,000 | 414,480,000 | 0.41 | $169,936,800 | 26.4 | $10.82 |
| 2005 | 14,500,000 | 395,850,000 | 0.43 | $170,215,500 | 27.3 | $11.74 |
| 2006 | 15,800,000 | 428,180,000 | 0.46 | $196,962,800 | 27.1 | $12.47 |
| Source: California Department of Food and Agriculture 2006 Directory | ||||||
 |
 |
 |
 |
 |
 |